New feature: shop.LEGO.com stock level graph
Posted by Huw,
In January this year, we started to make use of the new product feeds that LEGO made available for its French and German affiliate programmes and which enables us to show shop.LEGO.com price and availability information for these countries.
The data feeds, which are provided by a different affiliate network to the US, UK and Canadian ones, contain a lot of information, most of which is of little interest. However there was one field in them that I thought might provide something interesting, particularly if analysed over time: stock level.
So about a month ago, I started recording stock levels and dates in the database to enable stock over time to be graphed. The result is, as suspected, interesting but whether it's actually useful or not, I am not yet sure.
Before I show you the graphs, I'll mention what little I know about how shop.LEGO.com fulfilment works. It's my understanding that there are two distribution centres, one in Europe and one in the USA. The European centre ships to all of Europe and also countries in Australasia and Asia that are served by shop.LEGO.com. Thus, the figures in the German product feed that I've been recording will show stock available to be shipped everywhere except North America.
 The current stock level and a link to display the graph of stock over time, are shown on the side bar of set details pages at the bottom of the 'Availability at LEGO.com' panel.
Here are some sample graphs for The Simpsons House and The SHIELD Helicarrier: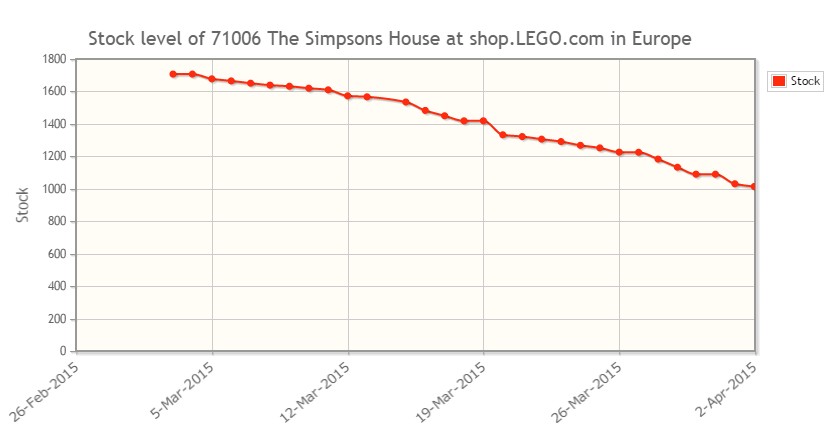
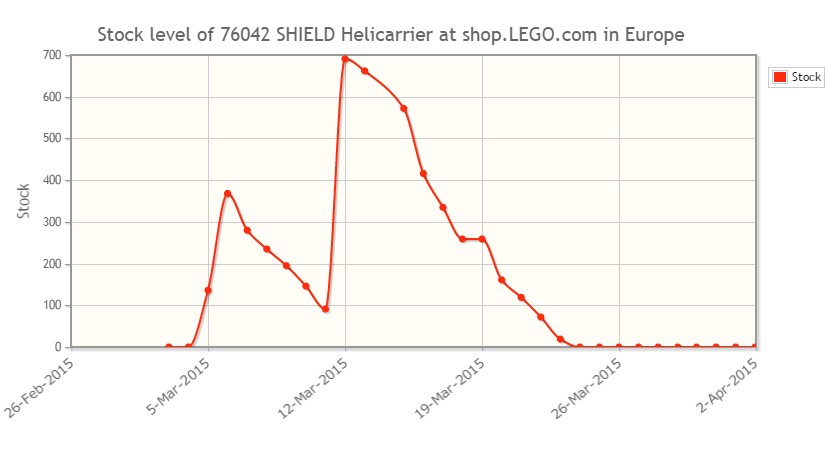
All very interesting, but is the information of any use? And is it accurate? In the top graph you can certainly see that The Simpsons House is selling steadily and won't go out of stock any time soon. In the lower one you can see that it sells very quickly and also being periodically restocked. The graph suggests it's been out of stock for a week or so, although it can still be ordered from shop.LEGO.com which would appear to be a discrepancy in the data.
I guess one possible use for the information might be when you are dilly dallying whether to place an order or not. If you were after a Helicarrier and looked at its graph on the 22nd March you might have decided to place an order then rather than risk it going out of stock given the line was approaching zero that day.
Another use, which I am still investigating, might be to use the data to determine top sellers, items that have just gone out of stock, items that might go out of stock soon and also those that have just been restocked and collate it all into a daily alert.
Anyway, the feature's there and data will continue to be collected. Make whatever use of it you see fit and if you have any suggestions for what could be done with it, let me know. And, before you ask, the US and CA data feeds do not provide stock level figures so I will be unable to provide a similar feature for North America.
1 like
15 comments on this article
Wow, this is a really stunning new tool and i will be using it lots, ive always liked the idea of being able to see the stock of a new Lego set and how well its selling :)
Definitely nice feature. Can see the popularity of the item :) Indirectly, it will also show when will our local toy shops restock the sets.
I just checked some of the technic sets. And it mainly shows that most of the people are reading reviews as some sets which were given quite a low rating are selling slowly, like the arctic truck. Only 200 per month were sold. While 24hr race car has about 500 sales.
wow and bionicles are so not selling.
Don't forget that this data is only about shop.lego.com - I imagine this will frequently show the larger exclusive/hard to find sets as selling faster than the smaller (particularly if you only look at the images without taking note of the numbers) - average buyers are more likely to pick up smaller sets in shops and considering how far apart Lego stores are compared to other shops which have more frequent discounts it's fair to assume this data will be interesting but only massively useful on exclusives.
It definitely is interesting though, and will be interesting to see how sales line up with promotions.
I'm sure resellers will be all over this artical. However, I do find this very useful as sometimes I really wish I could have known when a product will stop being produced. I missed my chance on the horizon express and had to fork over some cash on eBay that was more than retail. Can't wait for this information to be availible for the U.S.!
Something tells me LEGO are going to get sniffy about this data being exposed.
^ I did wonder that but then it is publishing it freely for any of its affiliates to view and use.
The worse that'll happen will be that the data disappears from the feed. Shall we take bets on how long it takes for the Brickset effect to backfire and for that to happen? :)
I wonder why they offer the info on the EU distribution center only. That said, the knowledge of stock levels is useless when there's a massive purchasing glut, and orders aren't pulled sequentially, as witnessed this past January. Has TLG commented on making any improvements to the back end of their LEGO.com?
Yeah, I'm also surprised that TLG is okay with numbers like these being openly available. I can't currently foresee anything potentially damaging by having this info out there, but corporate minds think differently and are usually loathe to reveal anything.
Still a neat feature, but like stock market figures, interpretation could become almost anything. And how reliable is LEGO.com as a barometer for overall sales?
Certainly looks very useful for resellers gauging when to buy at the end of a product's lifetime.
Pity the US stock is not available. May have helped me plan what to buy while on my hols (and how much suitcase space to allow for!!)
Interesting but isn't it by definition only useful for exclusives?
I'd guess that stuff like Bionicle (mentioned above) probably sells loads more through supermarkets or Amazon than it does through Shop at Home. I'm not sure that extrapolating would be very helpful for smaller sets in particular.
Hmm, not sure exactly what this level is. Maybe the distribution centre only, separate from from stores, but maybe also separate from the online country specific sites ? The reason I draw that conclusion is that the stock number is 0 for Orthanc, Tumbler and X-Wing (and only 3 for Death Star), yet all of those report as available on Lego UK, with 5 available for Death Star !?!?
^^^Not to mention stock levels for those high-selling sets like a 41062, 70818, or 60047 IMO.
The graphs are impossible to view on the mobile version of Brickset :(
This is an absolutely fascinating new source of information. We will certainly need to factor the limitations of the data into how we use it, but it is still clean enough data to do some analysis.
For example, I just completed an article which analyzes the LEGO architecture series to see which sets are the bestsellers, and see if there is a clear correllation between the set price and daily sales (hint, there is)
Sales are pretty close across the line, but there are some interesting outliers.
See what I found at: http://thebrickarchitect.com/2015/lego-architecture-sales-europe/
---tom