Collection analysis graphs
Posted by Huw,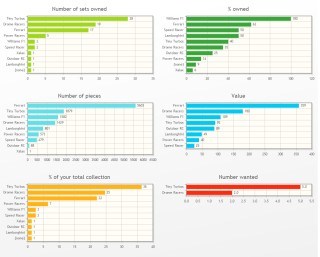
If you've looked at the sets collection analysis page lately you will have noticed that it now displays graphs instead of an impenetrable table. I've made a few enhancements to the graphs today in response to feedback in the forum which should make them even more useful and informative.
When you first view the page you are presented with two sets of graphs: one showing your collection broken down by theme, the other broken down by year. If you click on the bars of the theme graphs you'll be presented with data for that theme broken down by subtheme and year. Click on those bars and you'll be taken to the appropriate listing showing your collection. A similar action occurs on the year graphs.
The figures take only 'normal' sets into account, so product collections, random bags, extended product lines and sets that have not been allocated a number by LEGO (e.g. ComicCon exclusives) are not included in the totals. A maximum of 30 themes/years are shown to prevent the graphs becoming overlong.
The table is still available if you prefer a tabular presentation. The minifigs collection analysis page also shows the data graphically but drill-down has not yet been implemented; that's my next job...
I hope you find this useful. If you have any ideas for how else the data could be presented graphically, let me know in the comments.
0 likes
37 comments on this article
Wow, this is very cool and very well presented, thanks Huw!
The only thing I wish it had was a toggle on the sets by year graph to include dark age years (eg 0 sets owned) so I could get a better sense of the waxing and waning of my interest over time. (However, as a developer myself I know that adding a whole new type of one-off interaction can be annoying or even throw off a whole design, so no worries either way!)
Thanks again for making and constantly iterating on such a usable and useful site!
What units does the 'Value' use?
Sounds cool, but not working on my iPhone :/
Graphs are not displayed.
^ Make sure you are logged in, they won't appear otherwise. It uses Javascript and Canvas HTML elements to generate them, and it's working OK on my Android tablet, so if need be upgrade to a decent phone :)
^^ See the notes on the table page which state:
If you are in the USA, the value of your collection has been calculated using US prices.
If your country is one we have an exchange rate for, the value of your collection has been calculated using UK prices converted to your local currency.
If you're in any other country, the value has been calculated using US prices and is shown in US dollars.
--
We have an exchange rate for Lithuania litas, so the UK price will be converted using it.
Still not working in Chrome but fine displayed in Safari ! Need a decent browser in fact ^^ Nice job ;)
As other peoples collections are public will it be possible to also analyse their collections?
Wonderful, thanks a lot, Huw. Much easier to use now. ;)
I have an other suggestion. It has nothing to do with this, since this is already pretty good. But with the ACM. In the ACM you are asked to fill in when you aqcuired the set, maybe that data could be presented in some sort of timeline. This way you can see when you bought which set and how many sets you bought in a given time period.
@sebitsena, interesting... I tried my wife's iPad and it worked fine in Safari. She doesn't have Chrome installed to test with.
@bok2, not currently, but it's not a bad idea...
@stephan3321, I do need to do more with the ACM data although what you suggest may be tricky because the date field is free-form so some will enter July 2014, others 13/7/14 and others 7/13/14.
Wow, thanks Huw! Actually shocking how much I spend on Legos! :-/ BTW it works great in Chrome for me...
I love this... but if my wife ever saw this, I'd be done for!
Just wanted to let you know. Lithuania no longer uses LTL as currency. It is Euro now. Euro as primary currency came into effect from 2015.01.01
Does it indeed... OK, I've updated the database so Euro prices should now appear, but converted from GBP, as per the note above.
Great Job!
I like it a lot, thanks Huw
Nice job, Huw, although the data make sobering reading....
;-)
Could you please add a feature to user-specify the number of records displayed? We could specify the figure via our user profiles. By all means keep the default at 30, but it'd be nice to display more if possible.
What about an option to break out some of the more massive themes such as Town and Technic into sub-themes? I have so many sets in these themes (in sub-themes such as Launch Command, Divers, Res-Q, Extreme Team, etc.) that it kind of skews the data in a couple of the charts.
Excellent! Although I would also like to see some deeper optional granularity in the future as suggested by willherzog... ;-)
^^^ Good idea Dr.D!
^^ Does this not do what you require: http://brickset.com/mycollection/sets/graphs/theme-Town , or do you want to see subthemes at the same level as themes? That would get very confusing to look at and program, I reckon
Absolutely love this new feature! Great upgrade Huw!
On some of the themes, when I click on a bar under By Subtheme, I get this message: "No sets found. Please try another search term or select something from the drop-down lists." The By Year bars seem to work. I am using Firefox 37.0.2 on a 15in MacBook Pro running MacOS 10.9.5.
As others have mentioned, breaking down one's collection into numbers is quite sobering, not that I regret any of that spending! I am very much enjoying looking at the graphs. Thanks!
Very interesting did not realize I had so many bionicles, or how much ,especially last year, I had spent on Lego :/
Fantastic idea - perfectly done!
Excellent idea and execution Huw!
One suggestion I have is making it so duplicate sets are represented. For example, if I own three Death Stars and four Imperial Star Destroyers (this is a very theoretical example), have the "Number of Sets Owned" graph say Star Wars 2 (7) to indicate I have two different sets, but seven copies of those two combined.
Wow! This is wonderful. I love it. I really like the presentation and the way you can dig down. Great job Huw, keep up the good work.
Amazing, I love it. A whole new way to look at your collection.
@micano, it looks as if the {none} subtheme bar is the one that's not working. Is that the case for you? I'll get it fixed.
Is there a way to remove the polybags? Because we can't buy them at Lego store or Lego Shop.
When you buy a collection at Lego, you got just the sets.
Thanks
When viewing on iPhone some of the numbers are not visible off to the right of the bars. For example I have a lot more Star Wars than anything else so the pieces per theme chart has a massive bar for star wars which fills the width of the graph and the value disappears off to the right
^ given the limited space available on the screen, that's not really surprising, is it :)
This is great Huw!
People often ask what theme I collect the most, and it's Town apparently :)
Suggestion: (have the option to) not have duplicate sets count 'against' your theme's '% owned' . I consider myself a 'space guy' but my %owned is only 58%. This is partly due to all the US versions of a model (e.g. 487) being considered a separate set. (It's also because of all those US exclusives grr. but I digress)
Off topic, but also 'Thanks!' for the 'View inventory full screen' feature.
This looks very nice Huw, however I still miss the times when You could analise also subthemes (this was available before brickset layout change). Can this be done in the future?
There are no tables visible.
UPDATE: It works after my comment.
Is there the possibility to add a function that add the abnormal sets back into the data? I was wondering why my percentage jumped suddenly for Marvel but dropped for Star Wars, didn't realise that the exclusives, etc had been removed from the counts.
^ Maybe I can add it as an option in your preferences.
@Surt, click on a line and you can do so.
It's possible to display by LEGO elements in the graphs rather then by sets?
Thanks anyway for the readeable information, a panoramic view for collectors.
Huv, thank you so much for the wonderful job! It is really nice to finally be able to see the whole collection wrapped up in graphs!
I have one question which I believe was not presented yet (if otherwise, sorry, please be patient).
I own several old sets: their retail price clearly does not represent the current value (eg. NISB 10190 is worth more than 90USD).
Accordingly, I added the "real" (estimated) value in the advanced module but the "overall total value" in the graph seems to feed from the retail price and not from the one I put in the advanced info. Is there a way I can get the current total instead?
If not, NO WORRIES HUV! What you have done is more than enough : )) thank you again