A decade of LEGO in graphs
Posted by CapnRex101,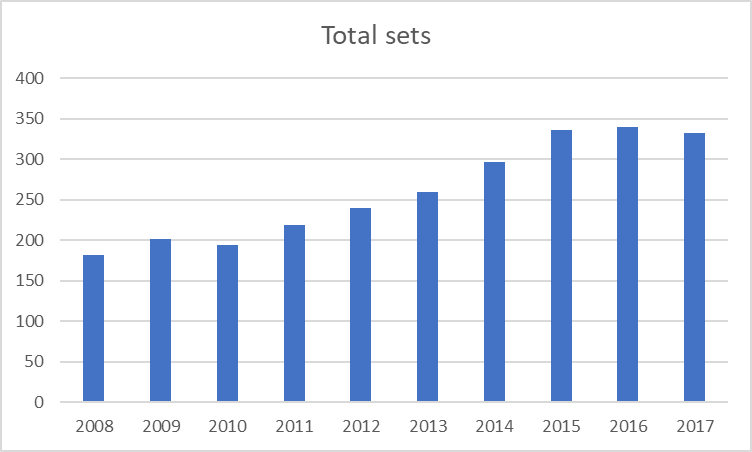
LEGO's product range has changed significantly during the last decade and appears to expand year on year. The quantity of larger sets also seems to be growing, thereby increasing both the average piece count and the average cost of items released during each twelve month period.
The Brickset database is an excellent source of information which allows us to evaluate the validity of these perceptions and draw our own conclusions from the data. Huw has compiled a selection of tables and charts showing the number, size and cost of sets released over the last decade which clearly demonstrate several interesting trends.
First, we should define the products within the scope of our analysis. Every year we record hundreds of items in the database, most of which are conventional sets. However, some are books, accessories and promotional items that are not readily available around the world. We have therefore limited our investigation to sets which have been sold at shop.LEGO.com and have excluded those we categorise as 'Gear' in our database. DUPLO and Collectable Minifigures have also been left out to avoid skewing the results, principally because of their effect upon the average piece count in a given year.
We are starting at 2008 because that is when we began collating accurate and complete data for prices from LEGO's affiliate product feed.
Here is the data we will be using, taken from the Brickset database and using XE Currency Converter:
| Year | Total sets | Total pieces | Avg pcs | Total / £ | Avg | Total/ $ | Avg | LEGO Exch Rate | Actual Exch Rate |
|---|---|---|---|---|---|---|---|---|---|
| 2008 | 182 | 70873 | 389 | £ 4,688.46 | £ 25.76 | $ 6,497.20 | $ 35.70 | 0.722 | 0.545 |
| 2009 | 201 | 67500 | 336 | £ 5,802.70 | £ 28.87 | $ 7,392.37 | $ 36.78 | 0.785 | 0.641 |
| 2010 | 194 | 70582 | 364 | £ 6,438.56 | £ 33.19 | $ 7,700.09 | $ 39.69 | 0.836 | 0.647 |
| 2011 | 219 | 68639 | 313 | £ 6,641.86 | £ 30.33 | $ 7,826.84 | $ 35.74 | 0.849 | 0.624 |
| 2012 | 240 | 76494 | 319 | £ 6,926.10 | £ 28.86 | $ 8,362.64 | $ 34.84 | 0.828 | 0.631 |
| 2013 | 259 | 89659 | 346 | £ 9,622.10 | £ 37.15 | $ 12,041.43 | $ 46.49 | 0.799 | 0.640 |
| 2014 | 296 | 104480 | 353 | £ 9,086.04 | £ 30.70 | $ 10,907.11 | $ 36.85 | 0.833 | 0.607 |
| 2015 | 336 | 116532 | 347 | £ 10,667.84 | £ 31.75 | $ 12,768.60 | $ 38.00 | 0.835 | 0.654 |
| 2016 | 339 | 132220 | 390 | £ 11,826.88 | £ 34.89 | $ 13,634.63 | $ 40.22 | 0.867 | 0.741 |
| 2017 | 332 | 154080 | 464 | £ 13,530.00 | £ 40.75 | $ 15,375.00 | $ 46.31 | 0.880 | 0.782 |
This table shows data concerning direct-to-consumer sets over the last ten years, also taken from the Brickset database:
| Year | Total sets | Total pieces | Total price / $ | Total price / £ |
|---|---|---|---|---|
| 2008 | 5 | 14788 | 1060 | 716 |
| 2009 | 7 | 12161 | 1060 | 773 |
| 2010 | 8 | 14193 | 1205 | 1072 |
| 2011 | 7 | 11830 | 1110 | 911 |
| 2012 | 8 | 13748 | 1160 | 949 |
| 2013 | 8 | 15324 | 1510 | 1209 |
| 2014 | 9 | 18122 | 1580 | 1282 |
| 2015 | 9 | 17666 | 1690 | 1442 |
| 2016 | 10 | 27444 | 2540 | 2104 |
| 2017 | 11 | 37895 | 3089 | 2594 |
LEGO is now producing more sets than in previous years
False. The total quantity of items produced continues to increase incrementally but the number of conventional sets released has remained fairly constant since 2015. In fact, 2017 has seen a slight reduction in the number of sets released in relation to last year.
Why? LEGO has evidently seen substantial growth in markets around the world during the last decade, most recently driven by the remarkable success of The LEGO Movie in 2014. LEGO has since become part of popular culture so is now more in demand than ever before and appeals to a wider audience. We are therefore seeing a greater volume of products being produced in each successive year, supported by further films.
While there has been little change in the number of traditional sets released since 2015, as shown on this chart, the volume of products produced overall has continued to rise every year since 2008. This may be attributed to a greater number of casual adult fans becoming interested in LEGO, many of whom might be more tempted by a keychain or branded accessory than a traditional set.
Nevertheless, the consistency in the number of conventional sets being released is perhaps surprising given LEGO's growing popularity. Such a trend may suggest that the company believes expanding its product range further would not increase overall sales. I think there is already some evidence that this is the correct decision as many Brickset members have expressed the need to choose between large sets this year as it is no longer possible to afford them all.
Sets are becoming larger on average
True. The average number of pieces found in sets has increased quite dramatically over the last couple of years and the total in 2017 far exceeds that of any previous year.
Why? This graph demonstrates a considerable fluctuation in the average number of pieces included in sets during the last decade, due to both a changing quantity of small sets and the influence of large direct-to-consumer sets. For instance, 2008 saw the release of 10189 Taj Mahal as well as 10188 Death Star, two of the largest sets ever produced at that time, so the average is higher than in the next year when fewer very large sets were released.
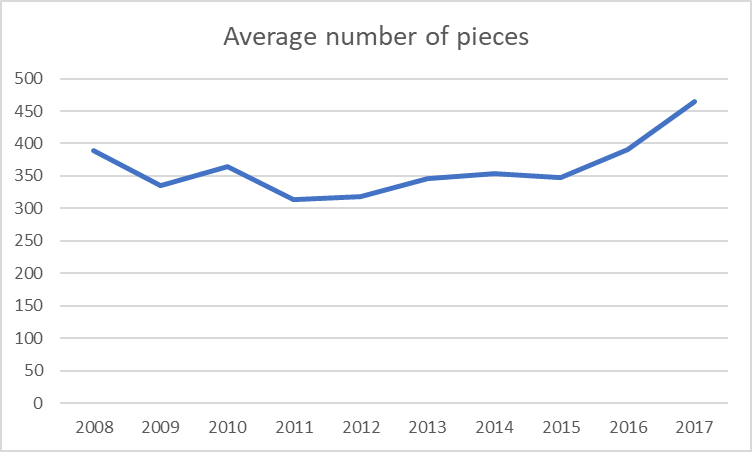
This trend is reflected to an even greater extent in the results for 2016 and 2017. We are seeing more direct-to-consumer sets being released than ever before and these are exerting a considerable effect upon the average piece count, bringing it over 450 for the first time in 2017. Four sets containing over 4000 pieces, including the 7541-piece 75192 Millennium Falcon, have been released this year and the chart below shows the extent to which the size of direct-to-consumer sets is increasing.
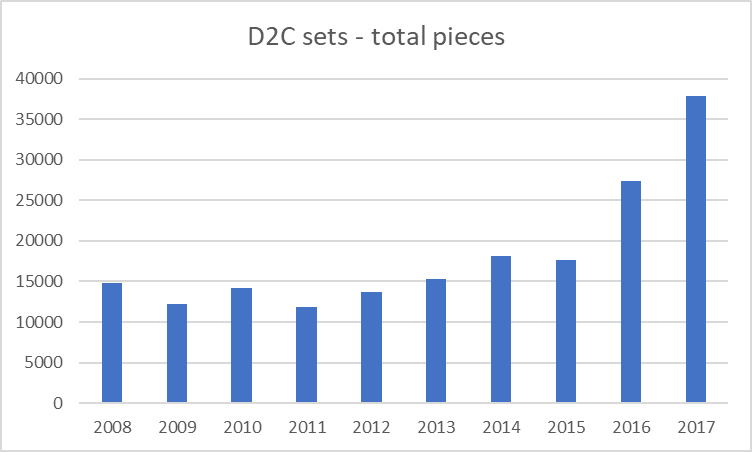
However, this chart does not reveal all of the relevant information. The last couple of years have also seen growth in the size of the largest standard retail sets, with 42055 Bucket Wheel Excavator being the most notable current example. The set contains 3929 pieces but is not a direct-to-consumer product so does not count towards the figures shown on the graph above. Many more such models have been released in 2017, including 70618 Destiny's Bounty, 21310 Old Fishing Store and 21309 NASA Apollo Saturn V, all of which raise the average piece count across LEGO's product range.
The average cost of sets is increasing
True. The average cost of sets is increasing as a greater number of large sets are being produced. However, 2013 shows a notable peak which is perhaps surprising as this does not correlate with a sudden increase in the size of sets.
Why? 2013 stands out as a clear anomaly on this graph. Previous charts have demonstrated that 2013 did not see a concentration of direct-to-consumer sets, nor is it particularly memorable for being very expensive, so the reason for this result was not immediately apparent to me. However, the database reveals that 31313 Mindstorms EV3 and 45500 EV3 Intelligent Brick were released in 2013 and that both sets contain very few pieces in relation to their prices. This explains the sudden increase in the average cost of sets in 2013 but the lack of matching growth in the size of sets.

Furthermore, two enormous Serious Play sets were released in 2013, both of which are exceptionally expensive. These have a considerable effect upon the average price of sets released in that year but, like the Mindstorms products, they have little influence upon the average number of pieces shown in the charts above.
The average cost of sets has increased at a more consistent rate since 2015, driven in particular by the expansion of the direct-to-consumer range. This is clearly visible on the chart above and is not at all surprising as 75159 Death Star became the most expensive set ever released in 2016, only to be surpassed by 75192 Millennium Falcon the next year. However, demand for these sets has not abated, suggesting that people are willing to spend more on a LEGO product today than they have been in the past.
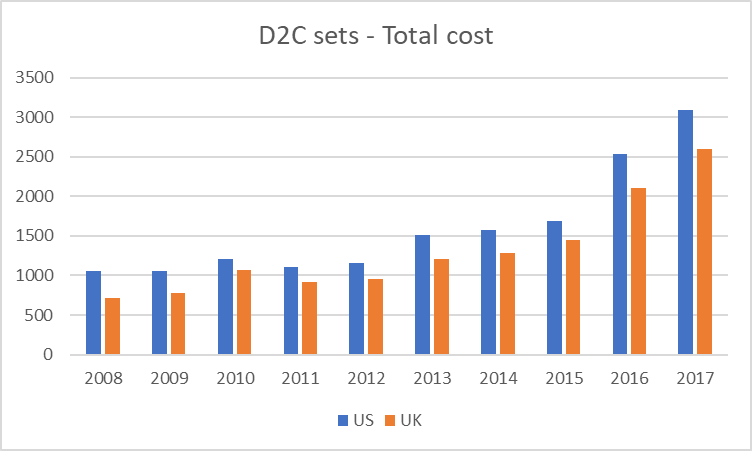
Collecting every set is becoming more expensive
True. Collecting LEGO products has always been expensive but it has become even more so in recent years. For instance, the total UK cost of buying every product in 2017 is more than triple that of collecting the entire range from 2008.
Why? There has been an increase in prices across LEGO's product range but the most notable reason for this dramatic rise is the greater number of large sets which inevitably come with a higher price point. This chart shows a fairly consistent rise in the total cost of sets released within each year, with 2013 being the only exception. However, the rate of change has increased in recent years, perhaps in response to The LEGO Movie's success as LEGO feels confident to release a greater volume of larger and more expensive items.
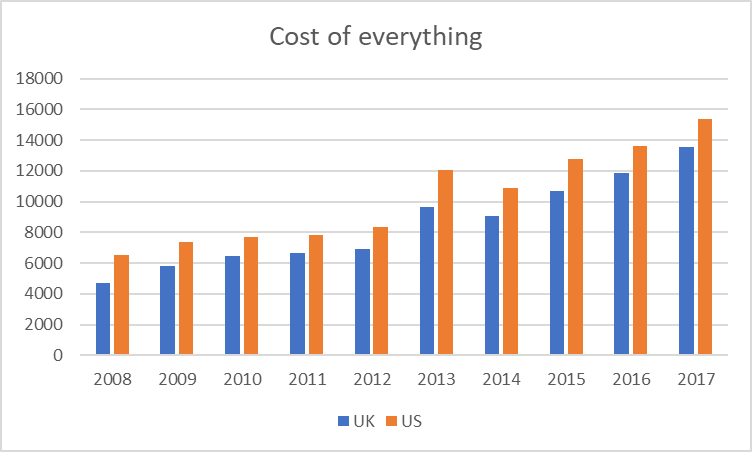
Furthermore, the Brickset database reveals that a greater percentage of products available today originate from licensed themes than was the case a decade ago. Just 14% of all the items released in 2008 were based upon an external property whereas 35% of those released in 2017 are licensed. Licensed products are typically more expensive than those created by LEGO so the total cost of collecting every set will increase in accordance with the proportion of licensed products.
Prices in the UK are higher than in the USA
True: The United States of America remains LEGO's largest market by total value* so the majority of sets are modestly priced when compared with other countries, although local sales tax must be taken into consideration. However, the gap between prices in the UK and the USA is closing.
*Germany is LEGO's largest market per capita.
Why? The British pound has been relatively weak in recent months. LEGO attempted to alleviate this change by increasing UK prices very slightly at the beginning of 2017 and this is evident on the graph below as we can see the rate of LEGO's exchange rate rising has slowed. However, the actual exchange rate between British pounds and US dollars is narrowing so LEGO may further increase UK prices in order to account for the currency's falling value, although those of us in the UK certainly hope they will not!
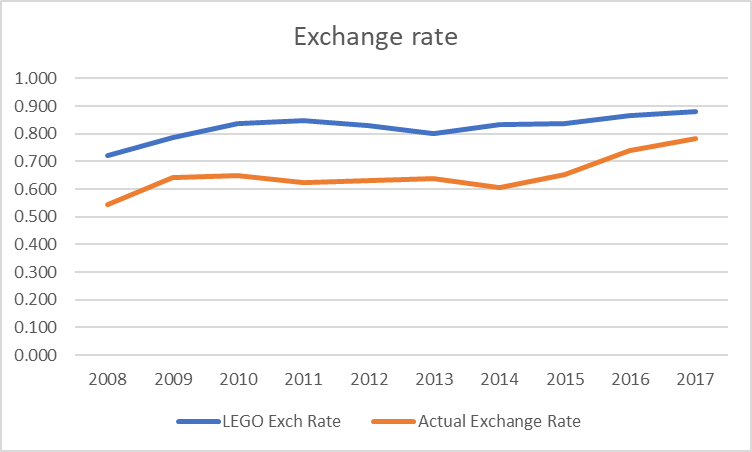
In addition, the fluctuation in LEGO's exchange rate, taken by comparing prices in the UK with those in the US, may be attributed to a greater quantity of large non-licensed sets being released in recent years. UK prices tend to be relatively low where original themes and the Creator Expert range are concerned so the expansion of these lines causes the average exchange rate to narrow.
I imagine that studying similar graphs based upon other currencies would also reveal some interesting trends but our records of prices in the UK and USA are most complete so we have limited our investigation to those for the moment.
Which data do you find most interesting and what conclusions can you draw from it? Share your findings in the comments.
I hope you have enjoyed this article. Let us know whether you would wish to see more like it in the future. Many thanks again to Huw for compiling these charts.
101 likes
35 comments on this article
It would be interesting to analyse the number of unique parts across each year’s sets! Are they going up, or down, I wonder?
Interesting article and thanks to CapnRex & Huw for the info.
When comparing UK vs US prices, it should be noted that US sales tax is not included in the quoted price (except for the states where it's 0%!) so this generally brings the prices much closer.
I used to buy a lot of the larger sets while over in the US, but these days the savings usually aren't enough to warrant using up all that precious luggage space!! I wish I understood why some sets are priced so differently across countries - seems very random.
I'd be interested to know how the price increase over the years compares adjusted for inflation.
Oooh nice stats. I do love a graph.
Very interesting data. I would've liked to also see median values as average will get skewed by out of range data like a really large set.
Very Nice stats. Thank for your work
Nice work! I'll second the desire for data with the median values - it would be interesting to see how it contrasts with the average.
I found the cost to buy everything very interesting. I have often wondered about how much a collector would have to pay. Great article.
Thanks CapnRex101 and Huw for putting this together. Yes - median data would be useful. As I revisit some of the sets from the 1970s it becomes clear that there are many more elements than there once were in sets that occupy a certain place in the range - it feels like elements that are 2x1 or smaller are much more common than they used to be - especially in friends sets, but I am not quite sure how we would capture than metric.
Thanks for a thought provoking writeup
Im not famliar with a unit "LEGO Exchange rate" and didnt find an explanation for that in the article. How does it stand against the other exchange rate used in the graphs?
Love the data and graphs! Excellent job.
Could I request one more dataset? A price per piece per year? I understand part counts are increasing and therefore the average price is increasing. But is the price per piece remaining the same?
Thank you!
I`d rather vote LEGO to have less sets per year, but more ideas (not actual "Ideas"-sourced series, but just something new projects or at least building technics). Technic theme is kind of poor last year. Porshe? Just another car, another truck, whatever... The last thing made me want was 42055. It is a really new mechanic model! 42070 is also another car but extremely overpriced as well and represents a bad pricing policy, I would extremely like LEGO understood the fans message on model sells rate to understand who is the bad boy:)
So my point is you now want just one or two techinc set from the year product line. I want to desire them all:) And don`t feel butthurt asking myself a question why the hell this 1.8k pieces set costs like 3k pieces set and doesn`t provide any personal feature to want it.
As of non-technics. Nexo Knights are awesome and I wish them long live. System sets get a better variety and really improved building techics in the last decade (i.e. no more top-oriented building). So I suddenly buy more system sets per year than technic which is my top love. As of this year I``d say NINJAGO City and Destiny`s Bounty are the best sets.
Good analysis, and very thorough!
I definitely agree with some of the other commenters that the info on price would feel more informative if it also included inflation-adjusted values. Metrics that measure value-for-money like price per piece or price per gram would also be useful. The amazing article “What Happened With LEGO” from a few years ago analyzed these factors and arrived at the conclusion that the value of LEGO was actually fairly stable. It’d be interesting to learn if that has changed in any meaningful way.
Here's a graph I was hoping you would do - I get the impression that the part counts are rising but the parts are getting smaller - would be interesting to know if that's true - perhaps the net weight of the sets is available somewhere?
Thanks for your constructive comments and suggestions. Median values are not so easily calculated in TSQL but there are solutions out there so I'll see if I can implement them.
As for price per piece, we didn't include that because the numbers seem to be all over the place so no useful conclusion could be drawn.
Here's the data, in pence.
2008 0.066152978
2009 0.085965926
2010 0.091220991
2011 0.096765104
2012 0.090544356
2013 0.107318841
2014 0.086964395
2015 0.091544297
2016 0.089448495
2017 0.089659977
In US cents:
2008 0.091673839
2009 0.109516593
2010 0.109094245
2011 0.114029051
2012 0.10932413
2013 0.134302524
2014 0.104394238
2015 0.10957162
2016 0.103120784
2017 0.101950633
Some great stats here guys!
I was wondering - is there any data about on how many of each set they make? Do they put a limit on any sets? I guess this info could be a but commercially sensitive....
That info is never released.
^Thanks Huw - I guessed that might be the case!
I am curious if any data is available with regards to average weight of sets per year.
Looking at LEGO sets over the years you do not really need a graph to see that sets are getting 'bigger' i.e. containing more pieces. But it does seem that the bricks used are getting smaller, or quite likely, the increase of size is made up by the larger number of small bricks.
These days, sets have just so many 1x1 tiles and cheese wedges, not to mention 1x1 round bricks for stud shooters.
As mentioned many times, price per piece is misleading because of the variance in piece size and the over-use of small parts in modern sets.
Bricklink has the weight of the pieces. If you trust it, it is possible to get the weight distribution. Here is an example.
75192: 7,521 pieces, 7,184.10g, 0.955 g/pc.
........Weight (g).............pcs....%age....% by wt
..............>0.000 (?)...............12.....0.16%...0.00%
..............>=0.000 (Zero)............0.....0.00%...0.00%
Tiny......>=0.010 (Non-zero)......749.....9.96%...1.46%
..............>=0.200 (1x1 plate)...1,734....23.06%...6.26%
Small.....>=0.360 (1x2 plate).....757....10.07%...4.00%
..............>=0.440 (1x1 brick)...1,491....19.82%..12.31%
Medium..>=0.800 (1x2 brick)...1,724....22.92%..27.03%
..............>=1.640 (1x4 brick).....462.....6.14%..12.06%
Large.....>=2.320 (2x4 brick).....176.....2.34%...6.64%
..............>=3.210 (1x8 brick).....416.....5.53%..30.24%
It's not going to show up well due to lack of formatting. :-)
Would be interesting to see how Germany fits in these graphs, seeing as it's the biggest market for LEGO per capita.
Thank you for a big peek into LEGO’s product history.
Thank you for this really nice and informative article, I love graphs!
Besides, I agree with the other comments that it would be very helpful to see all those statistics on price being adjusted for inflation.
Nice graphs - would be interested to see some pie charts showing the proportionality of different themes each year.
Did you include pre-tax/post-tax values in the exchange rate calculations - UK prices always include VAT where the US ones don't contain sales tax - depending on whether you do pre-tax/post-tax this can influence the exchange rate by 10% - 15%
I enjoyed that a lot, and would like to see more of these reports. Thanks for putting it all together!
Has anyone looked at the "official" shelf life of these new ones. Products seem to retire a hell of a lot quicker now than when I came out of my dark age around 2004.
Yes there are lots more sets but it feels if you don't buy them the year of release they all go. Even creator sets that used to float around on Lego's website for years are retiring within a year (park st townhouse already listed as retired).
It seems eBay and the supermarkets are a better bet than Lego's official site for most purchases now. Unless you can afford the brand new releases.
Great article. Just wondering about the comment that ‘licensed sets tend to be more expensive’. I thought you and Jangbricks did an article not so long ago that found this pricing policy/theory to be inconclusive?
@drbaggy US sales tax is different for every state, every county (local sales tax). At this time, the combined rate can range from 0% (e.g. no sales tax in Oregon) to over 10% in the most taxed locales. And that rate varies depending on legislated adjustments taking affect/expiring during the year. As of 2012 the highest rate is 13.725% in Tuba City, Arizona.
https://en.wikipedia.org/wiki/Sales_taxes_in_the_United_States
Always great to see aggregated data like this, and of course it's great to have a database from which to pull such facts. It was especially refreshing to me to see that the gap between LEGO & real UK/US exchange rates has been rapidly narrowing in recent years, despite widespread perception that the opposite has occurred. I hope that situation holds in its now best-in-a-decade position or even continues to improve. It'd be good to see the gap trimmed for other countries as well.
Almost a 30% increase in new sets per year in the short time since I got back into brick-based sets, though, yikes. No wonder sleep is becoming such a scarce commodity!
Lego put prices up 20% across the board one January for almost all sets - was that 2013, and accounts for the spike?
Thank you for your excellent work on this article Huw and CapnRex101! It's nice to see an informed article with multiple questions and answers about LEGO with statistical analysis, not just blind guesses. Well done!
What an awesome article! This is fascinating, good work on compiling and presenting all the stats!!
Interesting considering LEGO profits are down. Sounds like the org is not spending or investing wisely...Or maybe its just a growth period and they are taking more risks.
I wish the D2C sets would come down below 10 a year. I can justify buying one every other month which is only 5-7 depending on cost. With so many great sets, some fall through the cracks. 2016 and 2017 had 6 sets over $250, while 2015 only had 1. Hopefully since they have some HUGE ones coming out in 2017, it makes the 2018 sets come down in size a little.